















Your code. Your workflow.
Start with the code changes in your existing repositories.
Improve jwt refresh fallback (#1201)
+ add session token rotation
+ guard stale session reads
Built for CEOs, CTOs, CFOs and CHROs
GitMe analyzes code changes to estimate engineering effort and AI contribution — showing where work creates lasting value for smarter leadership decisions.


How GitMe works
Connect your Git host. Let GitMe evaluate the work. Bring Real Effort Value (R.E.V.) into your next leadership conversation.
Start with the code changes in your existing repositories.
Improve jwt refresh fallback (#1201)
+ add session token rotation
+ guard stale session reads
Encrypted, read-only access. Temporary analysis, with no source file retention.
Read-only accessYour repositories stay in your control.
Zero file retentionSource files are not stored.
See estimated effort, AI contribution, and the type of work delivered.
Example evaluation
Committer: Alex
The bigger picture
Developer performance · Illustrative demo
Executive Control Tower
REV Performance Lens
See true effort, not vanity activity. Compare squads on meaningful contribution quality.
12 Work Categories
Expose where effort is spent across features, fixes, refactors, operations, and more.
AI Optimization
Separate AI-assisted output from human contribution to improve quality and accountability.
Org-Aware Workforce Design
Model in-house vs. outsourced teams, expertise tiers, and talent pools for dynamic staffing decisions.
Cost, Flow, ROI impact
Up to 60%
Progressive reduction in development costs by optimizing head count.
Lean org structure · lower burn
Up to 30%
Productivity increase through early bottleneck detection and intervention.
Faster releases · less idle time
Up to 70%
Reduce sunk cost by focusing investment on the most valuable work streams.
Capital efficiency · higher impact
Inside GitMe · Interactive product tour
See how GitMe turns code changes into clearer investment, AI, and team decisions.
Start with your question
What is our engineering investment delivering?
A real question. A real path through the product.Start with a question
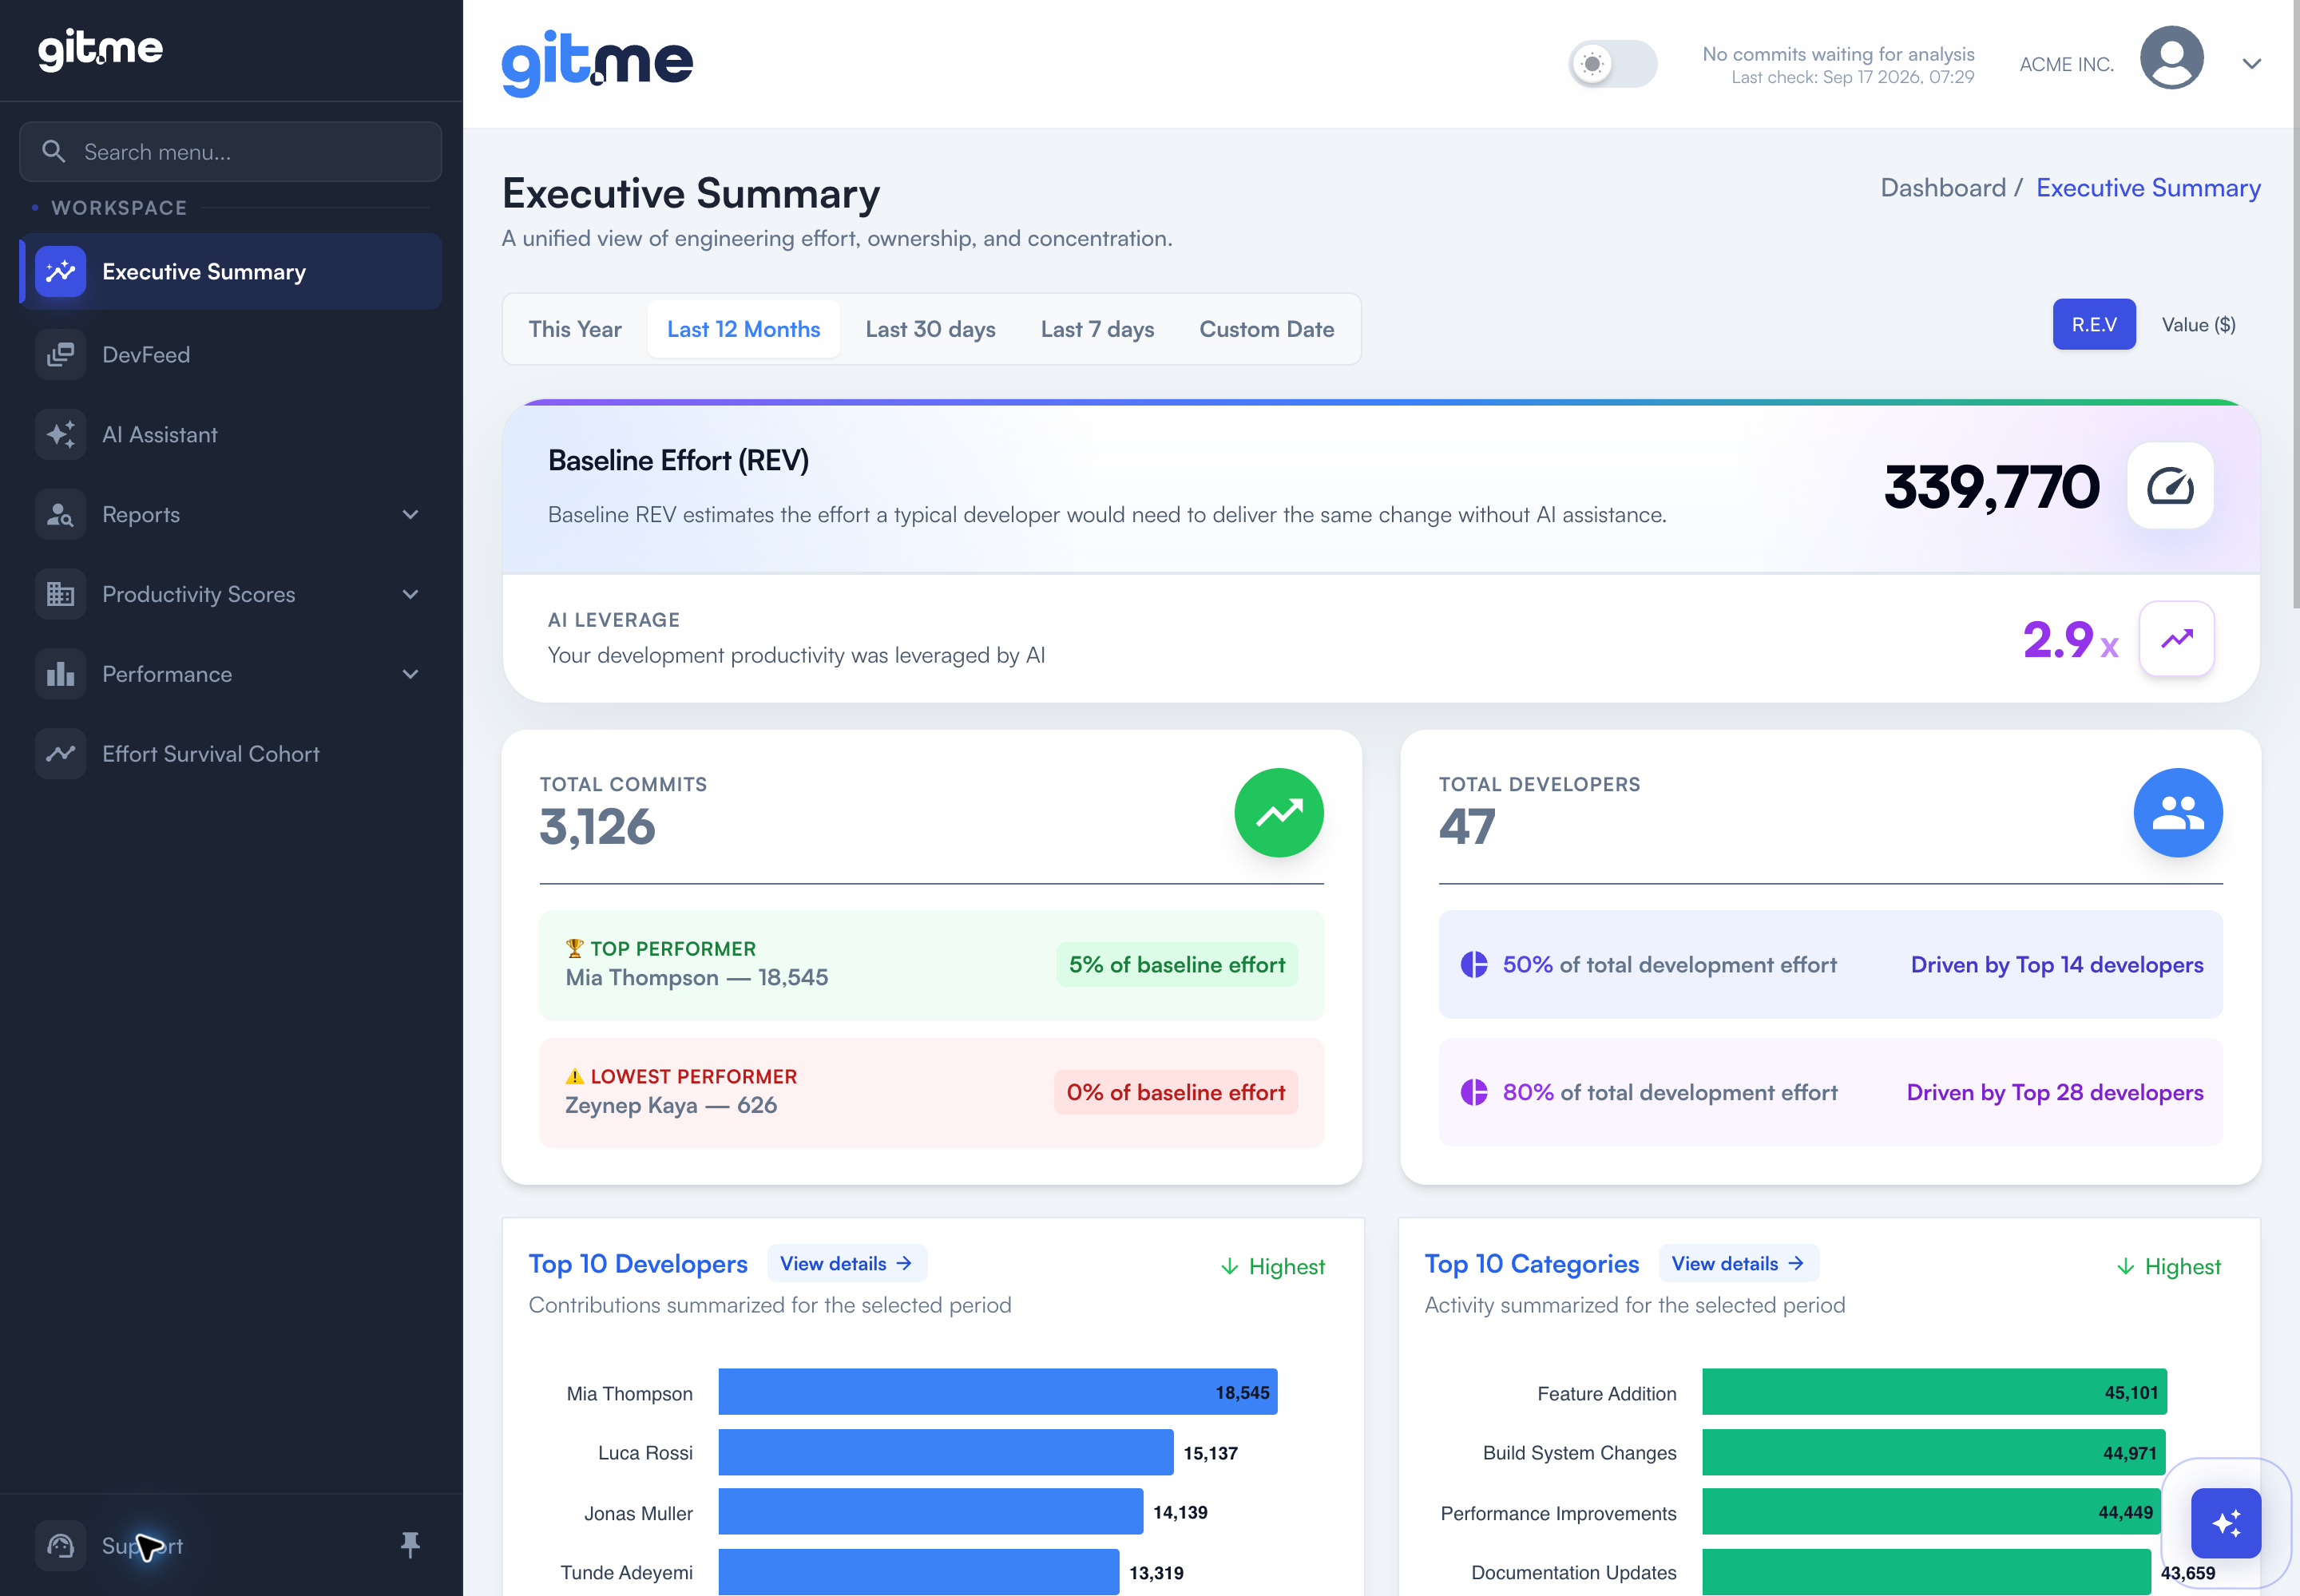
See the baseline effort behind delivered work, how concentrated that effort is across the team, and its estimated cost equivalent. Understand output and ownership before making investment decisions.
Compare estimated effort saved through AI with the human effort still required. Track the trend over time to understand where AI is providing leverage.
See how effort is distributed across features, maintenance, tests, security, and performance. Filter by project, repository, developer, or tags to investigate the investment mix.
Bring contribution trends, AI leverage, work mix, and durability together in one developer report. Compare with a relevant peer group to understand the work in context.
Follow how much past engineering effort remains effective as each cohort ages. Drill into a repository to see where durability deserves a closer look.
Turn engineering signals into a clear view of strengths and watchouts. Read the observed pattern and the recommended action before deciding what to investigate.
Read shipped work in plain language, then inspect the underlying change. Connect a business-facing update to its developer, repository, effort, and technical summary.
Ask Gitzy a question about your engineering data in plain language. Get a real chart, a written explanation, and a direct path to the relevant workspace.
Your team. Your code. Your answers.See what your engineering data can tell you.
Real product screens from a demo workspace. REV and AI leverage are estimates; dollar values represent effort equivalents, not revenue or profit.
Why you need GitMe
Evidence-based contribution measurement
GitMe's R.E.V. measurement has a 0.93 correlation with real contribution. Traditional metrics show much weaker relationships: Story Points around 0.4, Lines of Code around 0.2, and Commit Count around 0.1. That is why GitMe reveals real impact, not vanity activity.
R.E.V. ↔ Real Contribution
0.93
Story Points ↔ Real Contribution
~0.4
Lines of Code ↔ Real Contribution
~0.2
Commit Count ↔ Real Contribution
~0.1
Bottleneck Visibility
Surface review, refactor, and rework bottlenecks before they become delivery risk.
Effort Survival Rate
Evaluate which outputs survive over 12 months to measure engineering quality in context.
Organization Intelligence
Quantify contribution by team model, role, and specialization to optimize capacity planning.
ROI by Design
Translate daily development activity into board-ready efficiency, sustainability, and ROI indicators.
How it works
Designed for strategic decisions
Executive Outcome
GitMe helps leadership teams optimize head count, reveal bottlenecks, govern AI contribution quality, and align engineering operations with financial outcomes.